Digital Divide: Data Highlights Internet Inequities in Chicago
See coverage of this announcement in the Chicago Tribune, Chicago Sun-Times, WBEZ, WLS, and Courthouse News.
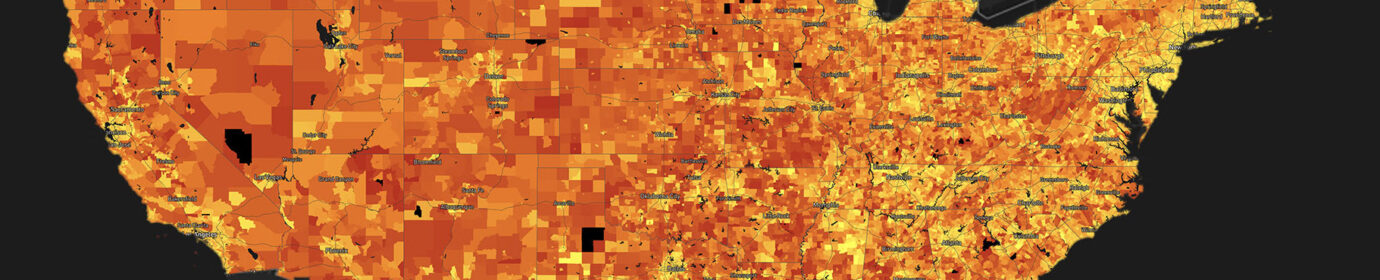
In 2021, the Infrastructure Investment and Jobs Act authorized $65 billion to expand broadband access and adoption, and address disparities highlighted by the COVID pandemic and the shift to remote work, school and health care. But to invest that funding most effectively for improving digital equity in the United States, new and deep data at a local scale must be gathered and analyzed to drive effective policy and advocacy solutions for the citizens and neighborhoods most in need.
The Internet Equity Initiative, an innovative effort from the University of Chicago Data Science Institute, seeks to fill this gap through a combination of new research, data analysis and communication, and community collaboration. The initiative is driven by an interdisciplinary team of researchers from UChicago’s Crown Family School of Social Work, Policy, and Practice and UChicago’s Department of Computer Science.
At today’s inaugural Data Science Institute Summit, the initiative unveiled a new data portal that combines public and private data from 20 cities around the nation. The site makes data accessible to governments, community groups, data scientists, and other interested stakeholders seeking to improve Internet connectivity to mitigate the “digital divide.”
UChicago researchers used data gathered on the portal to create a new analysis on disparities that ranked Chicago neighborhoods by Internet connectivity. The results emphasize the need for continued, targeted intervention to improve connectivity in particular sections of the city. In coming months, researchers will continue to deepen the Chicago data, adding critical, fine-grained information on where to take action to improve Internet connectivity and, in turn, develop approaches and tools that can be used for similar efforts in cities around the nation.
“It is now widely known and accepted that significant disparities exist in Internet connectivity across the United States,” said Nick Feamster, Neubauer Professor of Computer Science and The College, Faculty Director of Research at the Data Science Institute, and principal investigator of the Internet Equity Initiative. “Existing datasets affirm the existence of that problem. Yet, we are now at an inflection point where completely new datasets—and new analysis techniques—are needed for us to understand the nature of the problem, to determine how to appropriately target investments, particularly at the city and local level, and ultimately evaluate the effectiveness of those investments.”
The portal also features “data stories” showing how the data collected by the new research initiative can be used to answer a wide range of research and policy questions. Current data stories discuss the level of home Internet connectivity needed to support video-conferencing applications for remote home and school, and a comparison of the Internet performance in two households from different neighborhoods in Chicago that pay for the same Internet service.
“Ultimately, our aim is to reframe how all stakeholders think about Internet equity, so that discussions and decisions concerning this challenging problem can be grounded in sound data and analysis that directly speak to underlying causes and solutions,” Feamster said.
Finding Inequities Beneath The Surface of Data
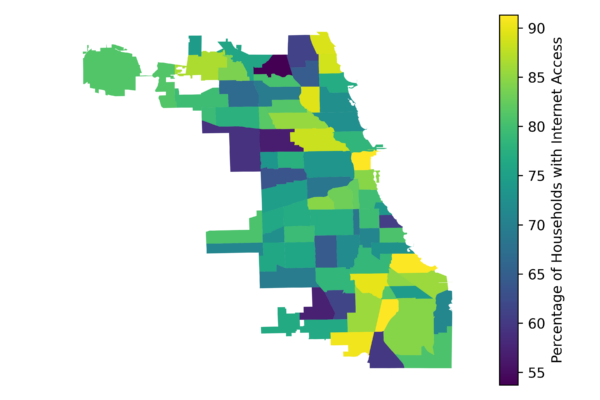
Internet Equity Initiative and student researchers found that, in Chicago, about 80 percent of households are connected to the Internet. But when the data is disaggregated to the 77 community areas of the city, it reveals deep, local inequities.
Burnside, West Englewood, Fuller Park, Englewood, and West Garfield Park have the lowest percentage of households connected to the Internet, each with over one-third of homes offline. In contrast, neighborhoods such as the Loop, Lincoln Park, and Beverly show over 90 percent connectivity. (A ranking of Chicago neighborhoods, by percentage of households connected to the Internet, follows at the end of the article.)
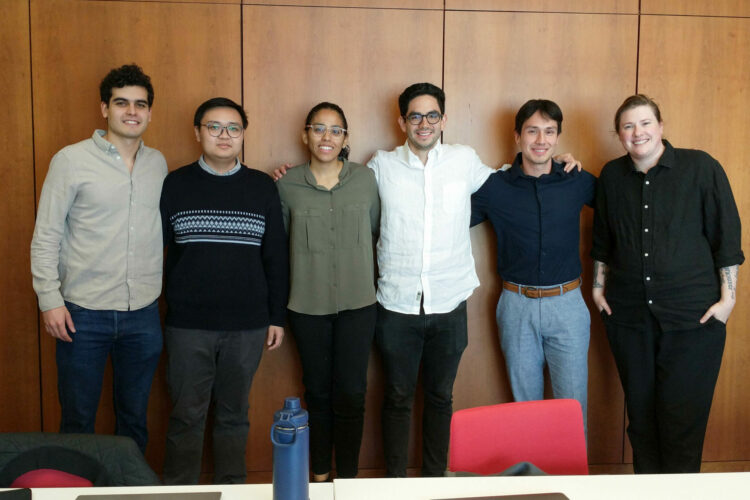
These statistics come from an analysis performed by UChicago undergraduate students Lena Diasti and Amy Maldonado and Computational Analysis and Public Policy master’s student Drew Keller, working with postdoctoral researcher Tarun Mangla from the Internet Equity Initiative. Together, they combined pre-pandemic information from the U.S. Census, the American Community Survey, the FCC, and the Chicago Data Portal to capture a localized snapshot of Internet connectivity in Chicago.
The students also found that connectivity strongly correlates with income, unemployment, race/ethnicity, and an economic hardship index. The data highlights and motivates the need to look at the data at a community level, underscores the need for continued intervention to improve connectivity in particular sections of the city, and can help quantify the impact of recently launched programs such as Chicago Connected, which provides free high speed Internet to households with Chicago Public Schools students.
“The students’ analysis gives us a clear quantification of the disparities motivating the work we are doing to change the way we think about the Internet as critical infrastructure,” said Nicole Marwell, Associate Professor in the Crown Family School of Social Work, Policy, and Practice and principal investigator of the Internet Equity Initiative. “The new data we are collecting goes beyond the traditional metrics to understand a new question about how the performance of the Internet varies across Chicago neighborhoods. This new information can help us advise on where new investments can build Internet equity.”
Multi-Scale Science for a Complex Challenge
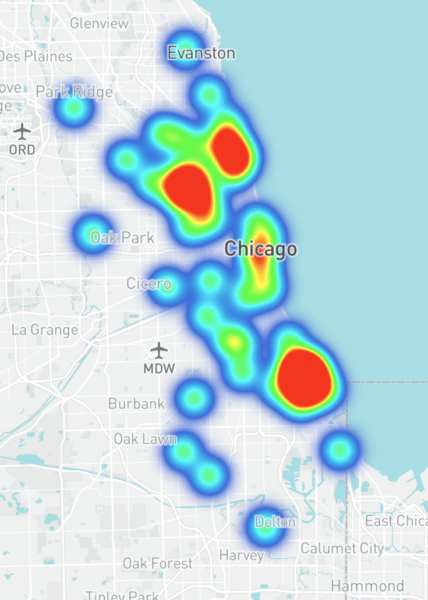
To add critical detail to the picture in Chicago, the initiative is now working with local community organizations and residents to collect several different measurements of Internet performance in households across Chicago. These data are distinct from any other available data on Internet performance, thereby filling key gaps in existing datasets.
Volunteers from across Chicago have installed a small device on their router, which allows the researchers to measure the performance of the Internet as data travels to and from the household. The study is currently in its pilot phase in 30 community areas and researchers are continuing to recruit volunteers and expand data collection. Researchers will conduct comparisons between neighborhoods, such as Logan Square and South Shore, with different community area-level statistics, while also examining variability across a larger set of neighborhoods across the city.
Together, the initiative’s portal and household-level research study on performance reflect a challenge that is national in scope but will require interdisciplinary, local research and intervention to address.
“Answering these questions requires developing entirely new approaches—from the types of data we gather, to the choices we make regarding where and how to gather it, to the techniques we develop to inform decisions,” Marwell said. “While we are piloting this approach in Chicago, we are producing a set of tools, procedures, and analyses that will enable researchers in other cities to replicate what we are doing in Chicago in their own communities.”
=====
Connectivity Data for all 77 Chicago Community Areas
Data source: American Community Survey, 2015-2019
| Community Area | Households w/ Internet (%) |
| Burnside | 57.77 |
| West Englewood | 61.91 |
| Fuller Park | 65.34 |
| Englewood | 65.40 |
| West Garfield Park | 67.38 |
| Greater Grand Crossing | 68.35 |
| East Garfield Park | 68.37 |
| Auburn Gresham | 69.22 |
| South Lawndale | 69.97 |
| Austin | 69.98 |
| North Lawndale | 70.01 |
| Chatham | 70.28 |
| Armour Square | 72.42 |
| Washington Park | 73.91 |
| Roseland | 73.95 |
| Avalon Park | 74.29 |
| South Shore | 74.46 |
| New City | 75.27 |
| Humboldt Park | 75.58 |
| Riverdale | 75.62 |
| Chicago Lawn | 76.31 |
| Montclare | 76.51 |
| Grand Boulevard | 76.82 |
| Woodlawn | 76.85 |
| Washington Heights | 77.08 |
| South Deering | 77.55 |
| Belmont Cragin | 77.97 |
| South Chicago | 78.57 |
| Brighton Park | 79.09 |
| West Pullman | 79.47 |
| Archer Heights | 80.30 |
| Gage Park | 80.40 |
| O’Hare | 80.42 |
| Oakland | 80.58 |
| Morgan Park | 80.58 |
| Hermosa | 80.60 |
| Dunning | 80.72 |
| West Lawn | 81.10 |
| West Elsdon | 81.46 |
| Hegewisch | 81.76 |
| Calumet Heights | 81.78 |
| Douglas | 81.82 |
| Norwood Park | 82.47 |
| Pullman | 82.65 |
| East Side | 82.86 |
| Garfield Ridge | 83.12 |
| Clearing | 83.44 |
| Rogers Park | 83.66 |
| Kenwood | 83.69 |
| Albany Park | 84.19 |
| Avondale | 84.79 |
| Lower West Side | 85.44 |
| Irving Park | 85.47 |
| Portage Park | 85.49 |
| West Ridge | 85.70 |
| Uptown | 85.79 |
| Edison Park | 85.97 |
| Ashburn | 85.98 |
| North Park | 86.06 |
| Mount Greenwood | 87.04 |
| Bridgeport | 87.06 |
| McKinley Park | 87.42 |
| Logan Square | 87.83 |
| Edgewater | 88.20 |
| Jefferson Park | 88.27 |
| Near West Side | 89.30 |
| Hyde Park | 90.88 |
| Forest Glen | 91.21 |
| West Town | 91.57 |
| North Center | 91.76 |
| Beverly | 92.21 |
| Lincoln Square | 92.78 |
| Lincoln Park | 93.75 |
| Lake View | 94.27 |
| Near South Side | 94.83 |
| Near North Side | 94.93 |
| Loop | 97.86 |
Community Data Fellow Stephania Tello Zamudio helps broaden internet access for Illinois residents
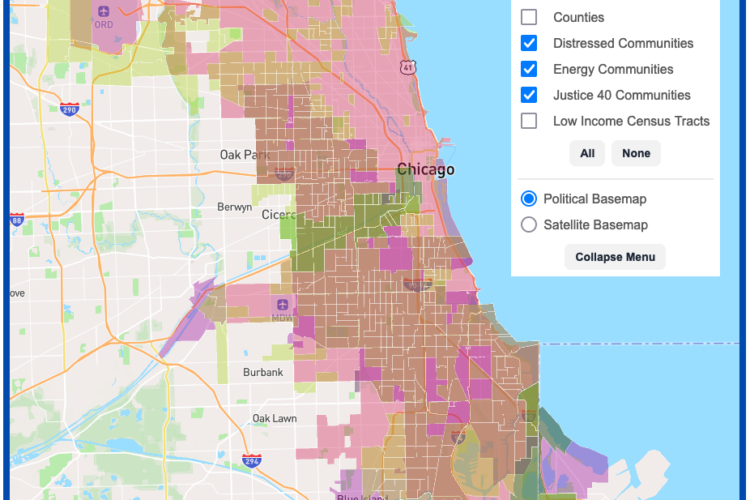
DSI Software Engineers create interactive map tool to maximize climate investment tax benefits

Incoming UChicago Data Science and Computer Science Associate Professor raises additional $106 million in new funding round for company, Together AI