

Netrics Internet Measurement Dashboard
Your Internet Measurement Dashboard
Welcome to the In-Home Internet Study and Survey! Our team at the University of Chicago thanks you for your time and participation.
You should have received a measurement device in the mail with printed instructions on how to set up that device. You must have the measurement device powered on and connected to your Internet modem or router before proceeding with the following steps. If you have not set up the measurement device already, please refer to the printed instructions and the installation video for guidance. Please reach out to us at broadband-equity@lists.uchicago.edu if you need additional help or have more questions about the device and the study.
The instructions below will guide you on how to access your personalized Internet performance dashboard. We encourage you to view the dashboard to learn about your Internet connection and the metrics that we collect through this study. You can access your dashboard through our web browser extension (strongly recommended) or through a web address.
Installing the Web Browser Extension
The Home Network Speed Test web browser extension—a software program that adds extra features to your web browser (i.e., Google Chrome)—is the easiest way to access your Internet performance dashboard. The extension also collects important measurements of your home network performance—the connection between your computer and your Internet access point.
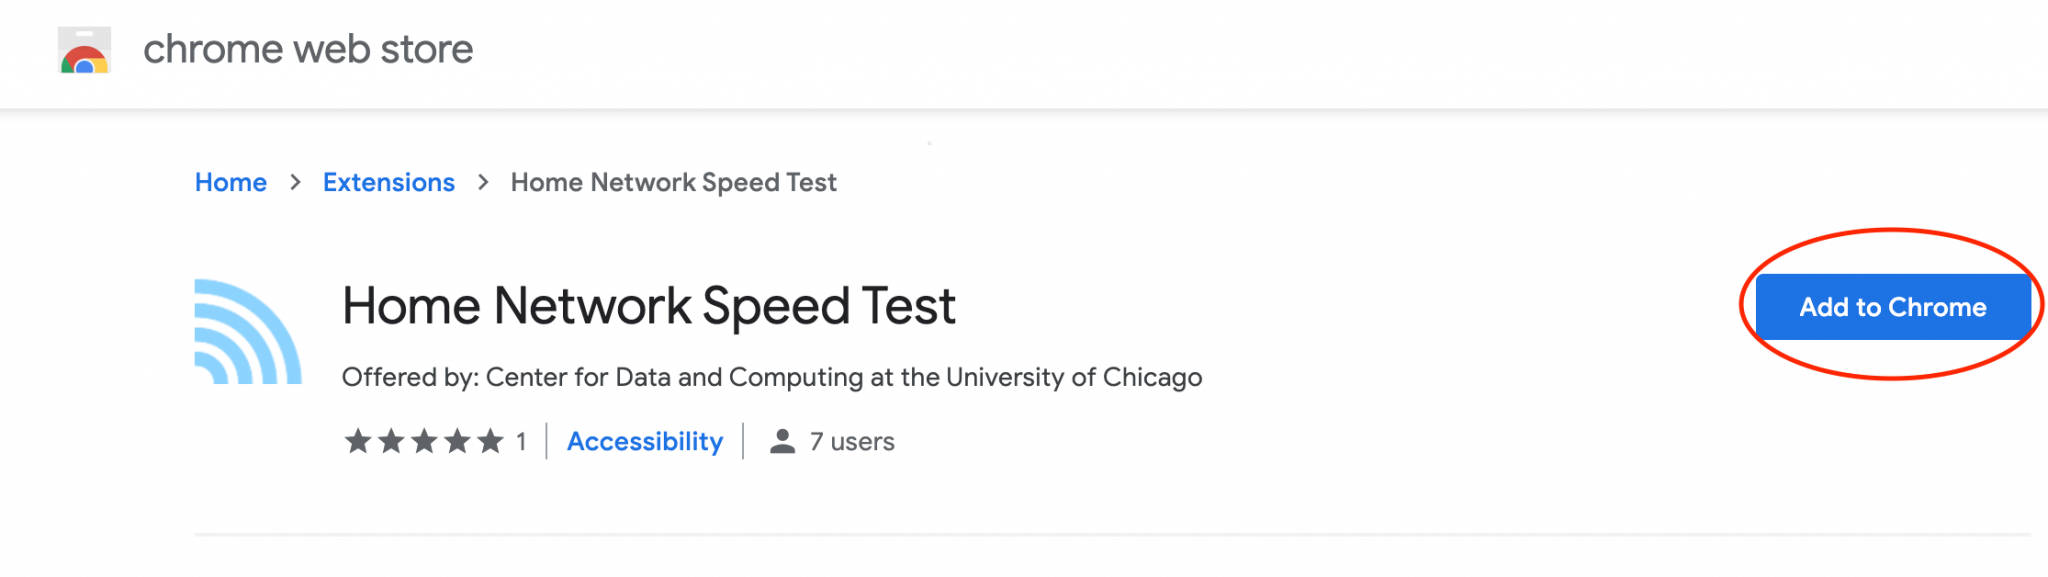
Step 1: Visit the Chrome Web Store
Visit the Home Network Speed Test page in the Chrome Web Store.
Note: You must install the web extension in a compatible web browser. The extension currently supports the following web browsers:
Google Chrome (Download)
Microsoft Edge (Download)
The remaining steps assume that you have Google Chrome installed as a web browser. If you are using Microsoft Edge, please refer first to the instructions here. If you need additional support, contact us at broadband-equity@lists.uchicago.edu.
Step 2: Add the Extension to Your Web Browser
Once in the Chrome Web Store, click the blue button on the page that says “Add to Chrome.”
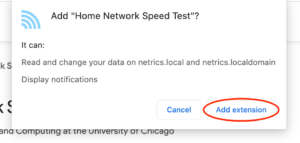
Step 3: Install the Extension in Your Web Browser
Once you click the blue button to add the extension, your web browser will prompt you with an alert notifying you of data that the extension will access. We do not collect any personal data, only the results of network performance tests. (The names “netrics.local” and “netrics.localdomain” refer to your performance dashboard.) Click “Add extension” to continue the installation.
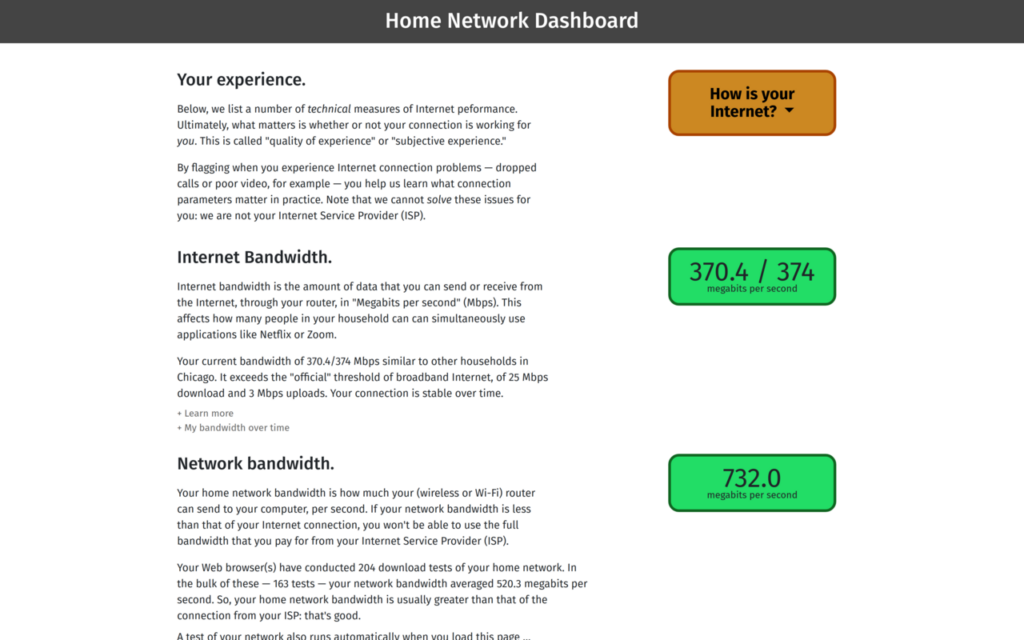
Once you have added the extension, your web browser will open your Internet performance dashboard in a new tab.
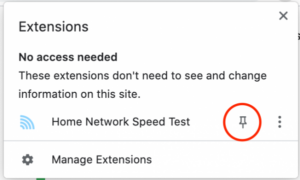
You can return to your dashboard in the future by first clicking on the extension icon in your browser toolbar and then clicking the Home Network Speed Test extension.
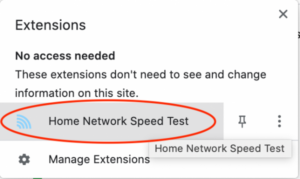
Note: You can pin the extension’s icon in your browser toolbar by clicking on the pushpin icon on the popup window.
Accessing the Internet Performance Dashboard Through a Web Address
If you do not have a supported web browser and cannot install one, you may still access your dashboard by navigating to either http://netrics.local/ or http://netrics.localdomain/.
Note: Your dashboard will only be accessible at one of the two web addresses above. You must include the “http://” portion of the web address or else the dashboard might fail to load. The web browser extension is strongly recommended as an alternative to these web addresses and to supply you with additional insight into your home Internet experience.
Thank you for your time and participation!