Quantifying the Social Drivers of Cardiovascular Disease in Space and Time
Doctors know that their patients’ cardiovascular health is more than just biological. A multitude of environmental factors, from weather to crime to public transit access, can affect an individual’s risk of cardiovascular disease and the effectiveness of medical treatment. But the medical risk scores used by physicians to make decisions about their patients only rarely take these non-biological influences into account, due to a lack of data and uncertainty about just how much of an impact they have on health.
If doctors could understand the specific impact of each environmental or social factor on a patient’s health, they could provide more individualized care. However, the relationships among all of the different factors affecting health are very complex which makes interpretation of their individual effects very challenging.
With a Center for Data and Computing Data Science Discovery seed grant, a new partnership of physicians, epidemiologists, and spatial data scientists will tackle this massive challenge. By combining existing datasets from University of Chicago Medicine, the National Weather Service, NASA, and the City of Chicago Data Portal and applying machine learning and spatial data science approaches, the project will produce a new cardiovascular disease model that combines clinical and social risk factors like never before.
“Everyone knows it’s bad to be poor, everyone knows it’s bad to live in a high crime area, everyone knows it’s bad to live far from your health care center and other infrastructure,” said Corey Tabit, Assistant Professor of Medicine at UChicago Medicine. “What we don’t know is how bad is it, how far away is too far, how poor is too poor, how much crime is too much crime? And further, what’s the comparative effect of being poor versus high cholesterol? Or if you smoke, but you live in a better area, do they offset each other? Comparing the associations of these different factors will be really astounding.”
In the clinic, cardiovascular disease risk is most commonly assessed using the Framingham risk score, an algorithm based on the results of a landmark study that has run since 1948. But the Framingham study and score both focus on biological contributors to health, such as diet, exercise, and genetics/family history. Attempts to create a score for social risk factors, such as the Neighborhood Deprivation Index, are limited by their use of broad, national measures such as the U.S. Census.
“There’s nothing that’s really looking at the granular level of the neighborhood,” said Elizabeth Tung, Instructor of Medicine at UChicago Medicine. “In Chicago, we have a lot of very granular data, that we don’t necessarily have nationally; nobody does. Looking at it from this microscopic level in Chicago could be really interesting to see how much better of a predictor or social risk score can we create.”
Some of that data comes from University of Chicago efforts such as MapsCorps, which conducts an ongoing deep survey of community resources such as grocery stores, exercise centers, pharmacies and other local assets. Other sources include the City of Chicago, which provides in-depth data on crime, transit outages, and other local factors, NASA air quality data, and National Weather Service measurements. The project will merge these datasets with patient-level records from the UChicago Clinical Data Research Warehouse to study how these social variables affect medical risk and outcomes.
“We’re trying to go back to the roots of data science, and bring in some theory to beef up our findings so that they’re interpretable at the end of it. The goal is not to have a black box that just spits out a number, but to bring meaning to it.”
Marynia Kolak, assistant director for health informatics at the Center for Spatial Data Science
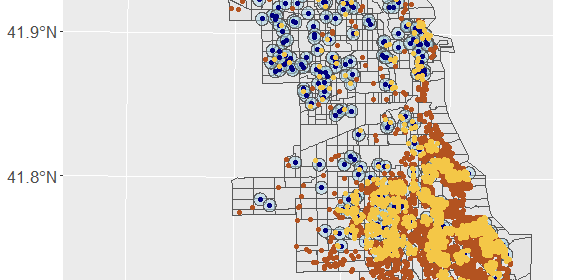
Key to the analysis will be the use of spatial analytics methods, such as spatiotemporal buffers, to study how the influence of social factors changes with distance and time. For example, a violent crime on the same block as a patient’s home might have more of an impact on cardiovascular risk than a similar crime a mile away; similarly, a crime last week could be more impactful than a crime three months ago. Researchers will estimate these relationships for several hundred socioeconomic and environmental variables and produce a new model for cardiovascular risk.
“We’re bringing both social science theory and social epidemiology theory to data science,” said Marynia Kolak, Assistant Director for Health Informatics at the Center for Spatial Data Science. “From a methods standpoint, it’s not common to bring spatial science, or even geo-computational methods at this scale to the analysis. We’re using these more powerful techniques to find the optimal inputs that will all go then into a massive neural net algorithm at the individual patient level.”
But because the ultimate goal is to improve clinical care, the end product must make recommendations that clinicians can both understand and act upon.
“We’re trying to go back to the roots of data science, and bring in some theory to beef up our findings so that they’re interpretable at the end of it,” said Kolak. “The goal is not to have a black box that just spits out a number, but to bring meaning to it.”
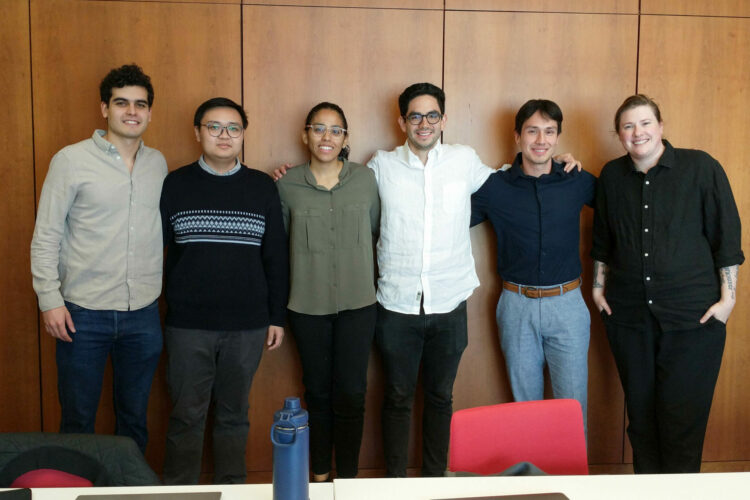
The research team, which also includes Cardiology Biostatistician Stephanie Besser, Cardiology Fellow Emeka Anyanwu, and Lab Manager and Data Analyst Rhys Chua, hopes to build software based on the model that can be incorporated into electronic medical records, giving physicians a more complete picture of their patients’ cardiovascular risk. The new risk score — and information about the specific factors that increase or decrease risk in each patient’s case — could also help drive treatment in both medical and non-medical ways, such as advising the patient to use a pharmacy in an area with lower crime, better transit access, and higher air quality. Or it could be used to launch new community-level interventions, lowering the risk of individuals by addressing the social risk factors that surround them.
“Based on this model, we could reclassify people who otherwise would have been low risk,” Tabit said. “We might look around them and say, they’re otherwise low risk, but they’re in a very high risk area, so I’m going to be even more aggressive in the risk factor modification. I’m going to lower their lipids even more, I’m going to keep a closer eye on their blood pressure. Or I’m going to go reach out to everyone else in the community and figure out what to do about them as well. There are a lot of possible implications here.”
[Image: Patients that intersect (yellow) with 500m crime buffers(blue), red represents non intersecting patients.]

Community Data Fellow Stephania Tello Zamudio helps broaden internet access for Illinois residents

DSI Software Engineers create interactive map tool to maximize climate investment tax benefits

Transform cohort 3 participant Healee uses AI to improve healthcare

