PalmWatch, a new tool created by DSI’s 11th Hour Project team, sheds light on palm oil production across the globe
Palm oil is a required ingredient for a plethora of household products, from food items like packaged pastries and chips to cosmetics and soaps or even biofuels. But most palm oil is produced on mono-crop plantations, grown on huge tracts of land that were once tropical rainforests and other biodiverse ecosystems. Mapping the links between palm oil mills, multinational corporations, and future deforestation risk is a difficult data science problem to solve, but thanks to a partnership with Inclusive Development International (IDI), the DSI used novel methods to solve this problem.
 The DSI and the IDI, with support from the 11th Hour Project, launched a new tool called PalmWatch on February 22. Using rigorous data science and advanced, low-cost data visualization methods, PalmWatch traces palm oil supplies from the ground level, where the environmental and social impacts of palm oil cultivation occur, to the consumer brands that use the oil in their products.
“This launch of the PalmWatch tool has been a long time coming,” said Executive Director David Uminsky of the Data Science Institute at the University of Chicago. “We began this work with some very motivated graduate students as part of the Data Science Clinic, an experiential project-based course where students work as data scientists under the supervision of DSI staff and faculty. This has all the hallmarks of a great data science problem. We needed novel efforts to correctly undertake the spatial analysis and we needed to advance visualization methods under-the-hood to build the best interactive tool for the public.”
PalmWatch connects data sources that were previously unlinked
In an effort to increase transparency, multinational brands report the palm oil mills from which they source their material. However, creating a repository that sorts and organizes mills across the world requires collecting and standardizing this information. And even with this information, it takes additional computational methods to understand how each mill impacts local deforestation risks. DSI’s 11th Hour Project team, led by Open Spatial Lab technical lead Dylan Halpern, had to contend with these challenges when they were building PalmWatch.
To connect these diverse data sets, they first had to scrape public disclosures from thirteen multinational consumer brands that show which mills these brands source from. This information then had to be standardized, with the palm oil mills geolocated on a searchable map. The data scientists also had to collect information about the mills, such as which companies own and operate them, which consumer brands they are affiliated with, and their RSPO certification status (a metric measuring sustainability of palm oil production).
“Matching consumer brands’ disclosed mills with the authoritative list published by the World Resources Institute [as part of the standardization process] was quite a challenge,” said Launa Greer, a software engineer at the DSI. “Disclosures were typically located on obscure corners of the websites and difficult to scrape for information due to wildly-varying PDF layouts. After collecting the mill records, we linked them to those from the Universal Mill List using a combination of fuzzy string matching, distance approximations, and id joins to produce the final set of mills used for the site. We hope that making a clean, consolidated, and machine readable dataset of mills available to the public will accelerate similar supply-chain research efforts.”
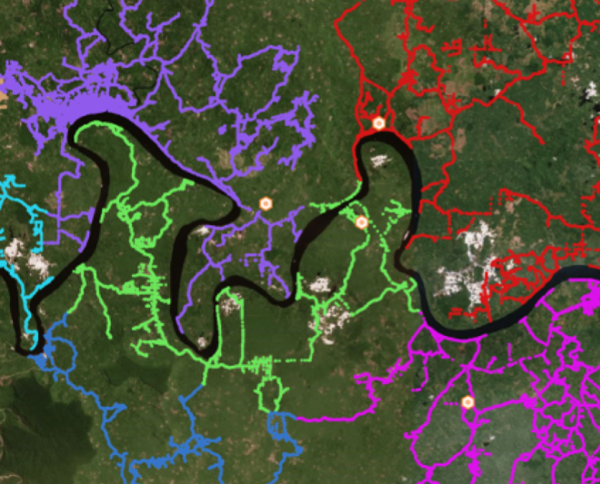
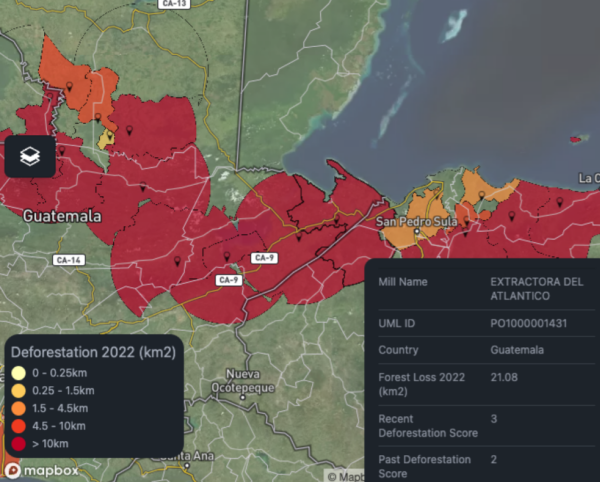
In order to understand deforestation in the regions surrounding the mills, Greer and her colleagues drew a ‘catchment boundary’ around each mill, to show the approximate geographical area a mill is likely sourcing palm fruit from. The boundaries were limited by known geographical constraints like local roads and times estimates that the industry sets for fruit spoilage standards.
Combining these diverse data sets with catchment boundaries and then overlaying 20 years of deforestation data from the University of Maryland within each mill’s catchment area helped bring all these pieces into a complete picture. PalmWatch uses this data to assign a past deforestation score to each mill, based on the amount of forest cleared within its catchment area, along with a future deforestation risk score, based on past deforestation patterns and the amount of forest that remains at risk. This information is then connected to the brands sourcing from each mill, and can be aggregated and filtered, allowing users to see deforestation by brand, mill owner and mill corporate group.
“I’m very excited that this dashboard will be owned by local communities and nonprofits working in the space,” said Greer. “Previously, investigating the effects of palm oil supply chains was a laborious process; now groups will have analytics at their fingertips.”
PalmWatch is built with future-proofing in mind
Making sure that PalmWatch would be cheap to maintain and easy to update was a vital part of the process to ensure the website will continue to be a useful investigative tool. PalmWatch was built to be lightweight and not require heavy computation that can add up in costs to web hosts over time.
“Ongoing funding for community-centered data science projects is not always guaranteed, so it’s important to architect software that is cheap to own in the long term,” said DSI’s Open Spatial Lab technical lead Dylan Halpern. “It’s tragic to see fantastic software engineering and community-engaged data science fade away from public view due simply to a server bill.”
PalmWatch uses a “baked data” model that runs analytics on three key outputs: company-mill relationships, mill impact data, and geospatial catchment areas. These are published through an API and use server-side rendering. Additionally, full data files are available for public download.
“We realized early on that palm oil production impacts each part of the world in a unique way; we integrated a collaborative content management system so that local advocates can add critical context, news, legal briefings, and other local knowledge to PalmWatch at every level – mill, country, consumer brand, and everything in between,” said Halpern.
When asked about ways that users can get engaged, he responded “If people are interested in contributing, they should absolutely contact Inclusive Development International at palmwatch@inclusivedevelopment.net.”
The development team has future plans for additional updates, including a data pipeline github, a disclosure contribution guide, and plans to offer hands-on training to social impact organizations and journalists who want to dig deeper into specific data questions.
PalmWatch highlights the global risks of deforestation due to palm oil mills
The novel use of global palm oil mill data, combined with a global focus, is already bearing fruit. Users can view trends in PalmWatch at the country level, leading to new insights. Countries where palm oil production is not yet as common (or tracked as completely), such as Columbia or Honduras, have lower past deforestation scores overall, but higher future risk and some higher current deforestation. This indicates that future efforts might be needed in countries and regions where focus on deforestation due to palm oil cultivation hasn’t been featured prominently in advocates’ work.
When asked about how Palm Watch can provide insights for journalists, advocates, and other researchers, Uminsky responded, “PalmWatch is a model of innovation that we couldn’t have completed without IDI’s partnership and the support of the 11th Hour Project. We look forward to continuing development of this tool to meet the needs of its users and hope to lead future projects like this in the future.”
![]()

Community Data Fellow Stephania Tello Zamudio helps broaden internet access for Illinois residents
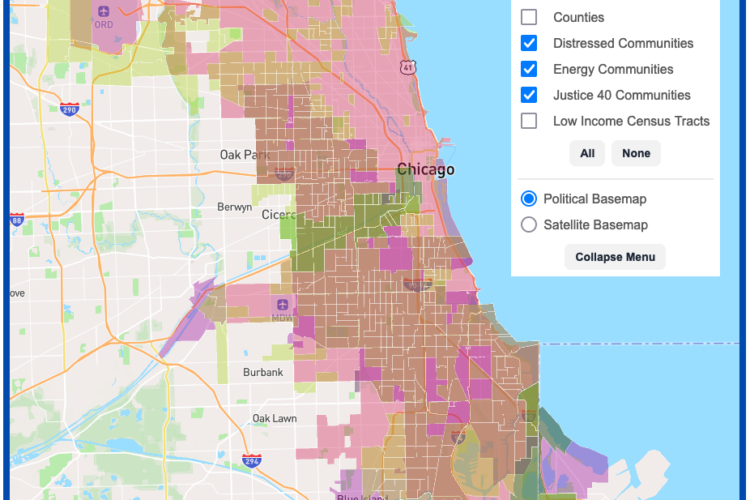
DSI Software Engineers create interactive map tool to maximize climate investment tax benefits

DSI Summer Lab Students Present Wide-Ranging Research